Marketing and sales are measuring different things.
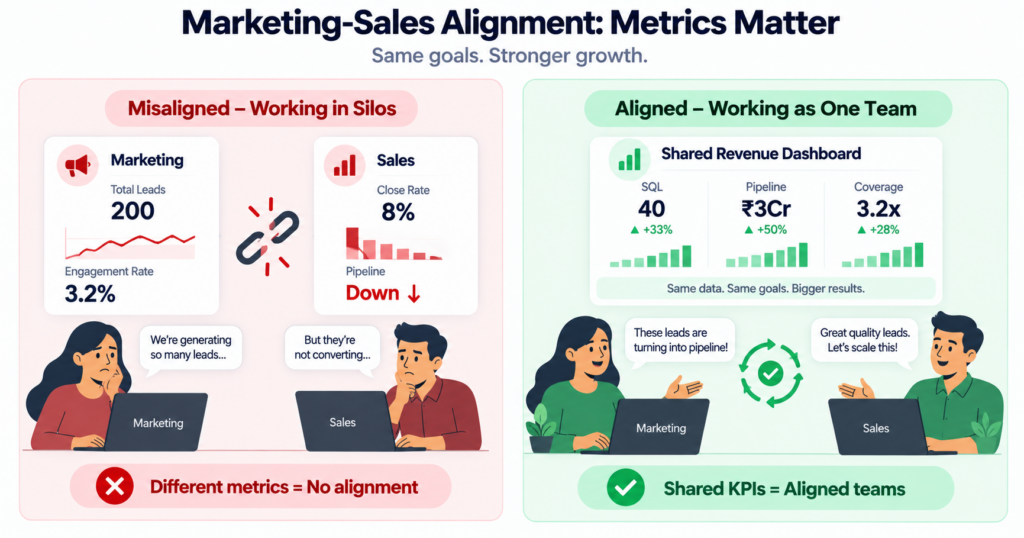
Marketing reports: “Traffic is up 40%. Leads are up 50%. The engagement rate is 3.2%.”
Sales responds: “OK, but the qualified pipeline is down.”
This disconnect kills companies.
Marketing feels attacked. Sales feels unsupported. Leadership doesn’t know who’s right.
Here’s the problem: Marketing and sales are measuring success at different points in the funnel.
Marketing measures awareness metrics (traffic, leads, cost per lead).
Sales measures conversion metrics (close rate, deal size, pipeline).
Neither is wrong. But neither is complete.
What’s needed is a shared KPI framework: metrics that both teams own, measure, and optimize together.
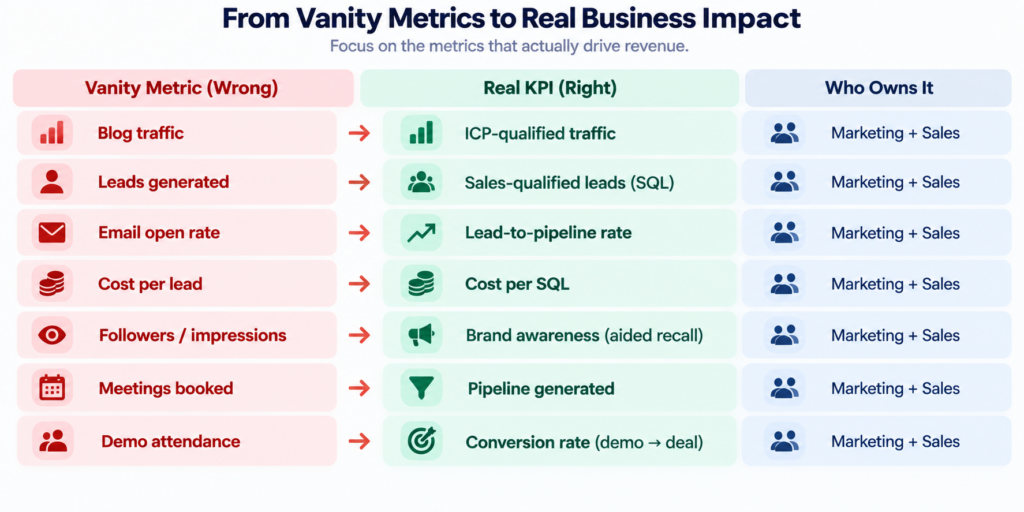
Quick Framework (Table)
Why Vanity Metrics Destroy Marketing-Sales Alignment
First, let’s define the problem.
Vanity metrics look successful but don’t connect to revenue.
Examples:
- Blog traffic (40,000 visitors/month)
- Email open rate (28%)
- LinkedIn followers (5,000)
- Webinar attendance (150 people)
- Content downloads (2,000 leads)
All of these are activity metrics. They measure how much you’re doing, not how effective you are.
Sales doesn’t care how many leads marketing generates. Sales cares how many leads turn into deals.
When marketing optimizes for vanity metrics:
- Quality goes down (more leads, worse leads)
- Sales has to spend more time filtering
- Deal cycle gets longer
- Close rate goes down
- Revenue doesn’t grow
Meanwhile, marketing reports success (leads up 50%), and sales blames marketing (leads are junk).
Both feel right. Both are measuring different things.
The 7 Real KPIs That Matter for Revenue
Here are the metrics marketing and sales should share.
KPI 1: ICP-Qualified Traffic
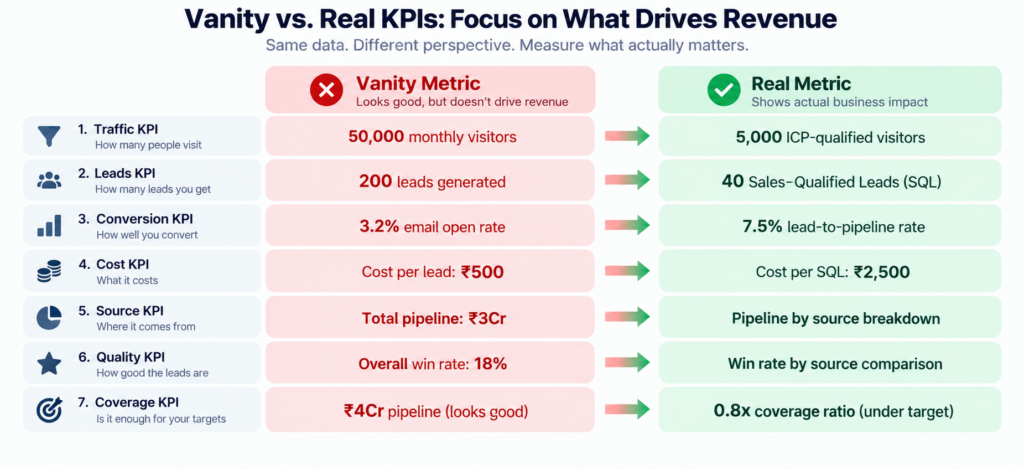
Vanity version: 50,000 monthly website visitors
Real version: Of those 50,000, how many match your ICP?
- Your ICP: B2B SaaS founders, ₹2-20 Cr ARR, India/GCC
- Actual ICP traffic: 4,500-5,000 of those 50,000
- Conversion: 5-10% of ICP traffic to leads
Ownership: Marketing owns traffic quality. Sales validates ICP fit.
Why this matters: Marketing can drive 100,000 traffic if it wants to (just run cheap ads). But if 90% aren’t ICP, sales won’t convert any. Better to have 5,000 ICP-qualified visitors that convert at 5% than 50,000 mismatched visitors that convert at 0.1%.
KPI 2: Sales-Qualified Leads (SQL)
Vanity version: 200 leads generated/month
Real version: Of those 200, how many did sales actually work?
- MQL (Marketing Qualified Lead): 200 leads meet basic criteria
- SQL (Sales Qualified Lead): 30-35 of those 200 are worth sales time
- SQL conversion: 30-35 leads that sales actually pursues
- Quality metric: 17% of MQL → SQL (83% filtered out as poor fit)
Ownership: Marketing qualifies leads as MQL. Sales qualifies MQLs as SQLs.
Why this distinction matters: Sales will only close deals from SQL. If marketing generates 200 MQLs but only 30 are SQL, then marketing is generating 85% waste. The real metric is SQL, not MQL.
KPI 3: Lead-to-Pipeline Rate
Vanity version: We generated 200 leads (who cares if they convert).
Real version: How many leads become pipeline opportunities?
- Total leads: 200
- Leads entering the sales process: 30 (SQL)
- Leads becoming pipeline opportunities: 10 (at deal stage)
- Lead-to-pipeline rate: 10/200 = 5%
Ownership: Marketing owns lead quality. Sales owns nurture and progression.
Why this matters: This metric connects marketing effort to the sales pipeline. It’s the bridge metric. If lead-to-pipeline is 5%, marketing knows that every 200 leads should generate 10 pipeline deals.
KPI 4: Cost Per SQL (Not Cost Per Lead)
Vanity version: Cost per lead = ₹5,000
Real version: Cost per SQL = ₹33,000
- Total marketing spend: ₹100L/month
- Total leads: 200
- Cost per lead: ₹100L / 200 = ₹500,000 (or ₹5L)
- SQL (leads sales actually works): 30
- Cost per SQL: ₹100L / 30 = ₹3.3L (₹33,000 per SQL if using a smaller example)
Wait, let me recalculate with realistic numbers:
- Monthly spend: ₹30L
- Total leads generated: 200
- Cost per lead: ₹30L / 200 = ₹1.5L per lead
- SQLs from those 200: 30
- Cost per SQL: ₹30L / 30 = ₹10L per SQL
Ownership: Marketing owns CAC for SQL.
Why this matters: You can lower the cost per lead infinitely (just stop running ads and lower quality). The real metric is cost per SQL. If your cost per SQL is ₹10L and ACV is ₹20L, you can afford it. If ACV is ₹5L, you can’t.
KPI 5: Pipeline Generation by Source
Vanity version: Total pipeline: ₹3Cr/month
Real version: Breakdown by source
- Outbound: ₹1.5Cr
- Content: ₹0.6Cr
- Webinars: ₹0.5Cr
- Events: ₹0.4Cr
- Paid ads: ₹0Cr
Ownership: Marketing owns the breakdown. Sales owns the pipeline.
Why this information matters: You can’t optimize what you don’t measure. If paid ads generate zero pipeline but cost ₹20L/month, kill it. If content generates ₹60L, double it. This metric shows which marketing activities actually drive revenue.
KPI 6: Win Rate by Lead Source
Vanity version: Overall win rate: 18%
Real version: Win rate by source
- Outbound: 22%
- Content: 15%
- Webinars: 12%
- Paid ads: 8%
Ownership: Marketing owns lead quality. Sales are closing.
Why this distinction matters: Some lead sources are higher quality than others. Content leads might have a higher win rate because they’re more educated. Paid ads might have a lower win rate because they’re less qualified. This tells you where to invest.
KPI 7: Pipeline Coverage Ratio
Vanity version: We have a ₹4Cr pipeline (looks good).
Real version: Pipeline coverage for the month
- Monthly revenue target: ₹1Cr
- Typical close rate: 20%
- Pipeline needed for ₹1Cr revenue: ₹5Cr (1Cr ÷ 0.20)
- Actual pipeline: ₹4Cr
- Coverage ratio: 4Cr / 5Cr = 0.8x (you’re short by 20% of your monthly target)
Healthy benchmark: 3-4x pipeline coverage ratio (for every ₹1Cr in monthly target, maintain ₹3-4Cr in pipeline)
Ownership: Marketing owns lead flow. Sales owns progression.
Why this figure matters: This metric tells you if you’ll hit revenue next month. A 3-4x pipeline coverage ratio is healthy (if you generate ₹3-4 in pipeline, you close ₹1 in revenue). 0.8x means you’re short and need to accelerate pipeline generation now.
How to Implement: The Weekly Alignment Meeting
Most companies don’t align around KPIs. So they don’t see progress.
Here’s the structure:
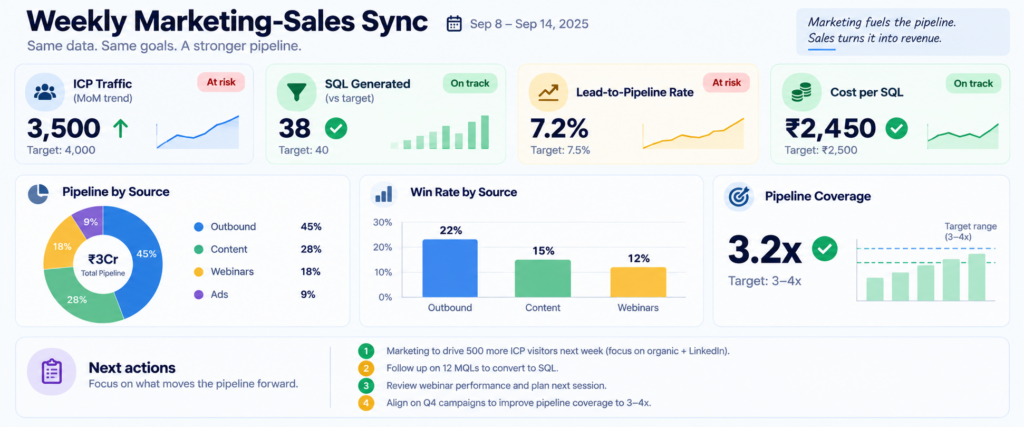
Weekly Marketing-Sales Sync (30 min)
What to measure:
- ICP traffic (MoM trend)
- SQL generated (vs target of 30-35)
- Lead-to-pipeline rate (vs. 5% target)
- Cost per SQL (vs. ₹10L target)
- Pipeline generated by source
- Win rate by source
- Pipeline coverage ratio (vs. 3-4x target)
What to discuss:
- Are we on track to hit revenue? (Check pipeline coverage.)
- Which lead sources are performing? (Check pipeline by source and win rate.)
- Where are we leaking? (Check lead-to-pipeline rate.)
- What should we optimize next month? (Double down on high-performing sources)
Who attends:
- Head of Marketing
- Head of Sales
- Operations (to track metrics)
Format:
- 10 min: Review metrics (dashboard)
- 15 min: Discuss misses and wins
- 5 min: Decide next week’s actions
How to Know If You're Actually Aligned
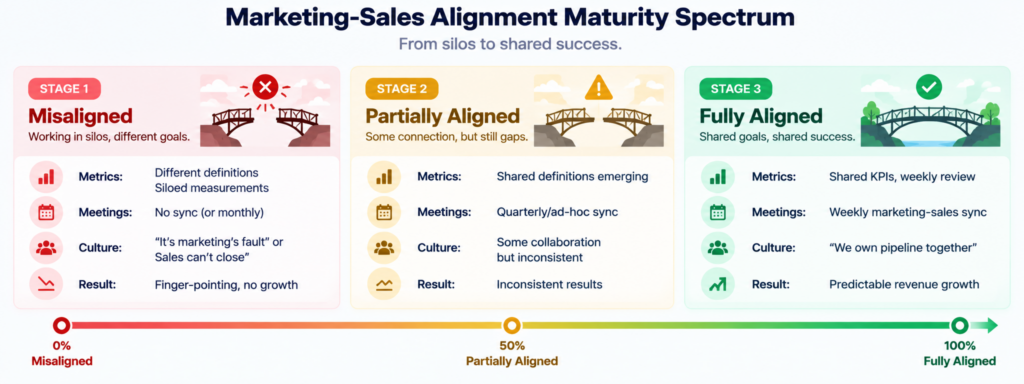
Sign 1: Same definition of “lead”
Marketing and sales agree on what makes someone a lead. No ambiguity. Marketing converts visitors to MQL, and sales qualifies MQL to SQL.
Sign 2: Weekly metric review
Every week, you look at the same dashboard. Both teams know the numbers.
Sign 3: Marketing knows the close rate by source.
Marketing understands which activities they own that actually drive revenue (because sales tell them the close rate by lead source).
Sign 4: Sales knows the cost per SQL.
Sales understands the cost of their pipeline and can evaluate the ROI of marketing activities.
Sign 5: You talk about the pipeline, not activity.
Conversations are about “pipeline generated,” not “emails sent” or “meetings booked.”
Sign 6: No blame
When the pipeline is short, it’s not “marketing didn’t generate leads” or “sales can’t close.” It’s “we need to do X together to fix the issue.”
Common Mistakes (And How to Avoid Them)
Mistake 1: Measuring only one stage
Marketing measures leads. Sales measures deals. Nobody measures the bridge (pipeline).
Fix: Track lead-to-pipeline rate. It connects both stages.
Mistake 2: Different definitions of “lead”
Marketing thinks a lead is someone who downloads a PDF. Sales thinks a lead is someone who is in a sales conversation.
Fix: Align on definitions. Use MQL (marketing qualified) and SQL (sales qualified) terminology.
Mistake 3: No source tracking
You don’t know if that deal came from content, outbound, or ads.
Fix: Track the source in your CRM for every lead. Every deal.
Mistake 4: Vanity metrics in leadership reports
The CEO sees “200 leads generated” and thinks marketing is winning, even though the win rate is down.
Fix: Report pipeline and revenue-influenced metrics to leadership.
Mistake 5: Optimizing for volume instead of quality
Marketing tries to lower cost per lead, which tanks quality.
Fix: Optimize for cost per SQL and win rate, not cost per lead.
The Mindset Shift
The biggest barrier to alignment isn’t systems or metrics.
It’s the mindset.
Marketing thinks, “Our job is to generate leads.” It’s the sales’ job to close them.”
Sales thinks, “Our job is to close deals. It’s marketing’s job to give us good leads.”
Both are partially right. But both overlook the larger context.
The reality: Revenue is a shared outcome. Both teams impact it.
Marketing generates demand. But if the demand is wrong, sales can’t convert it.
Sales closes deals. But if there’s no demand coming in, sales have nothing to close.
Neither team succeeds alone.
The aligned mindset:
“We own a pipeline together. We measure it together. We optimize it together.”
When that mindset takes hold, alignment follows.
Most B2B companies don’t have this alignment. Let’s audit your metrics and build a shared framework.